
Simulation
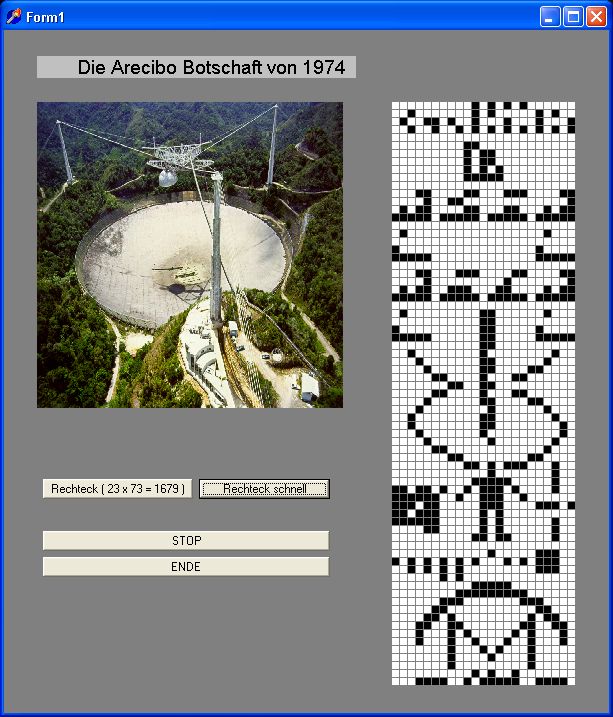
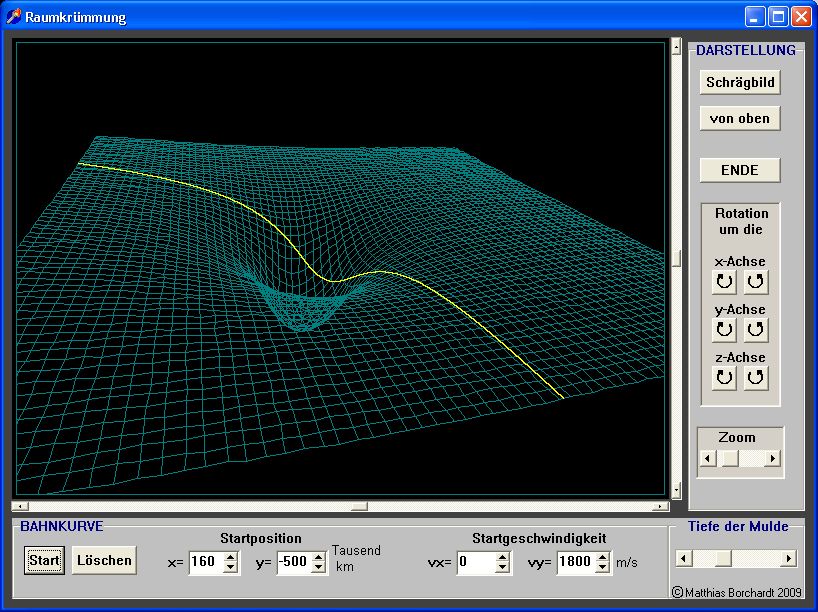
Programm "Raumkrümmung" von Matthias Borchardt
Stryker OR Planner
Lufthansa 747-400
Transportation modeling
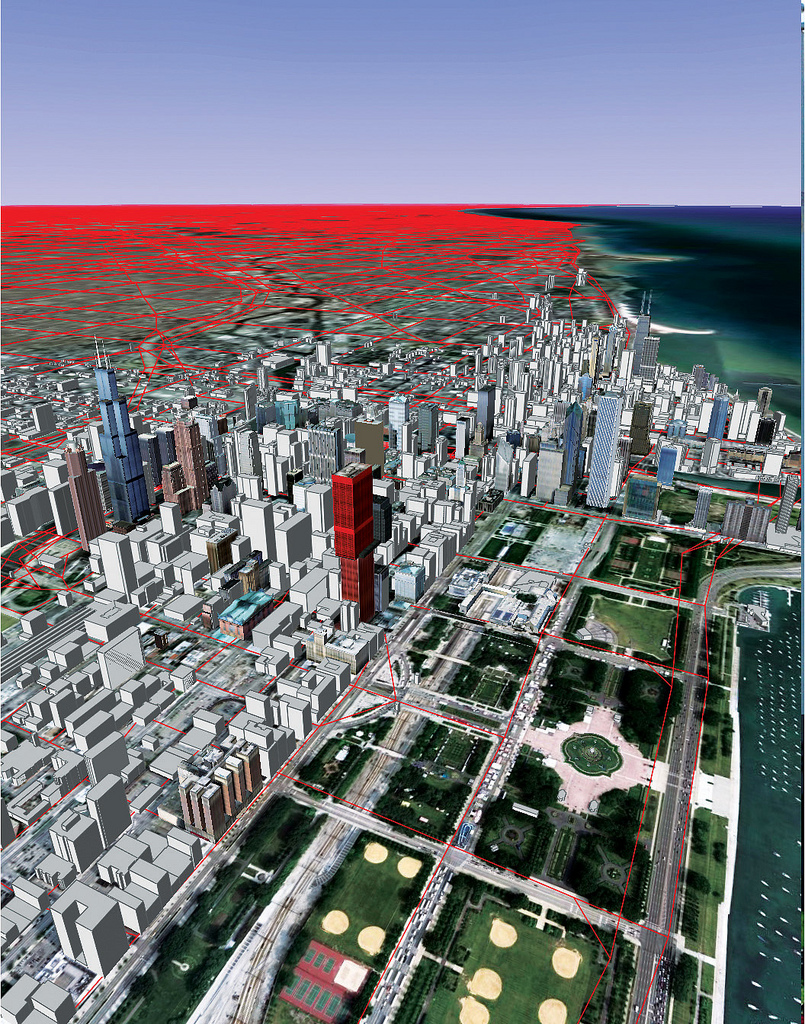
The red lines on this map of Chicago represent the different roads modeled by the TRANSIMS software program at Argonne National Laboratory's Transportation Research and Analysis Computing Center. The model has great resolution in the downtown area, but also incorporates a network of highways and thoroughfares that extends from Milwaukee to Kankakee and from Lake Michigan out to Rockford . Read the full story.
Crash-test simulation
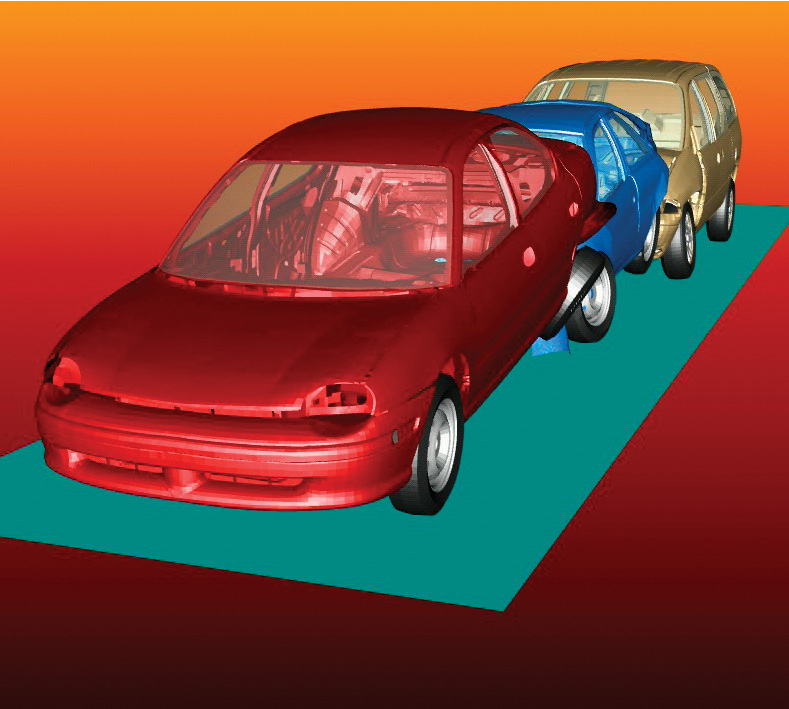
This screen shot of a three-dimensional finite-element model shows a three-car crash. In this type of simulation, conducted at Argonne National Laboratory's Transportation Research and Analysis Computing Center, separate processors compute the physics of small areas of each car but combine to determine the dynamics of the entire system. Read the full story.
Nuclear reactor simulation
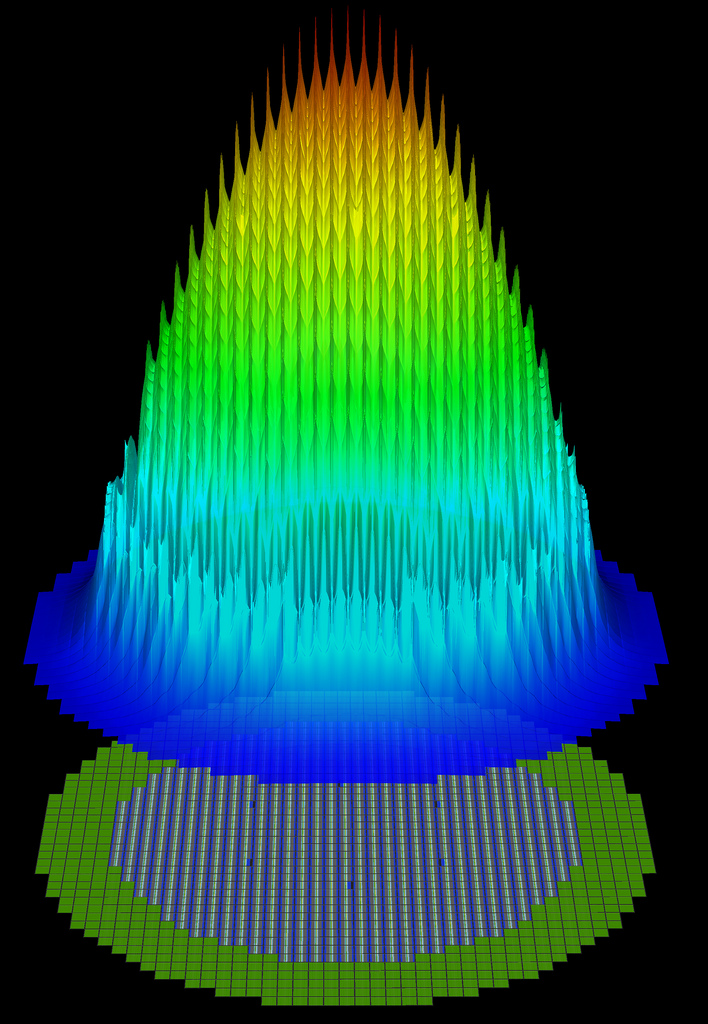
Image: An elevation plot of the highest energy neutron flux distributions from an axial slice of a nuclear reactor core is shown superimposed over the same slice of the underlying geometry. This figure shows the rapid spatial variation in the high energy neutron distribution between within each plate along with the more slowly varying, global distribution. The figure is significant since UNIC allows researchers to capture both of these effects simultaneously.
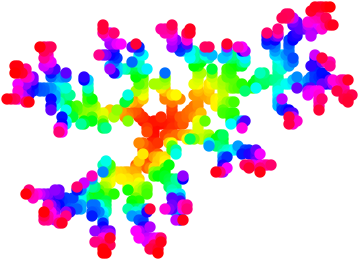
snowflake16 by golanlevin
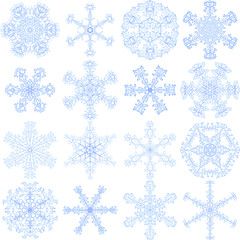
Algorithmically-generated snowflakes created interactively from my gestures using a diffusion-limited aggregation (DLA) algorithm. The applet which allows you to create similar snowflakes is online at http://www.flong.com/projects/newyear/.
golanlevin
snowflake1 by golanlevin
Coral Growth
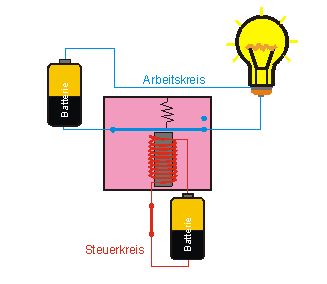
Das Relais
Herstellung von Transistoren mittels Planartechnik
Bild: LEIFI Physik
Bill Gosper’s Glider Gun in action
Bild: Kieff