
Nuclear reactor simulation
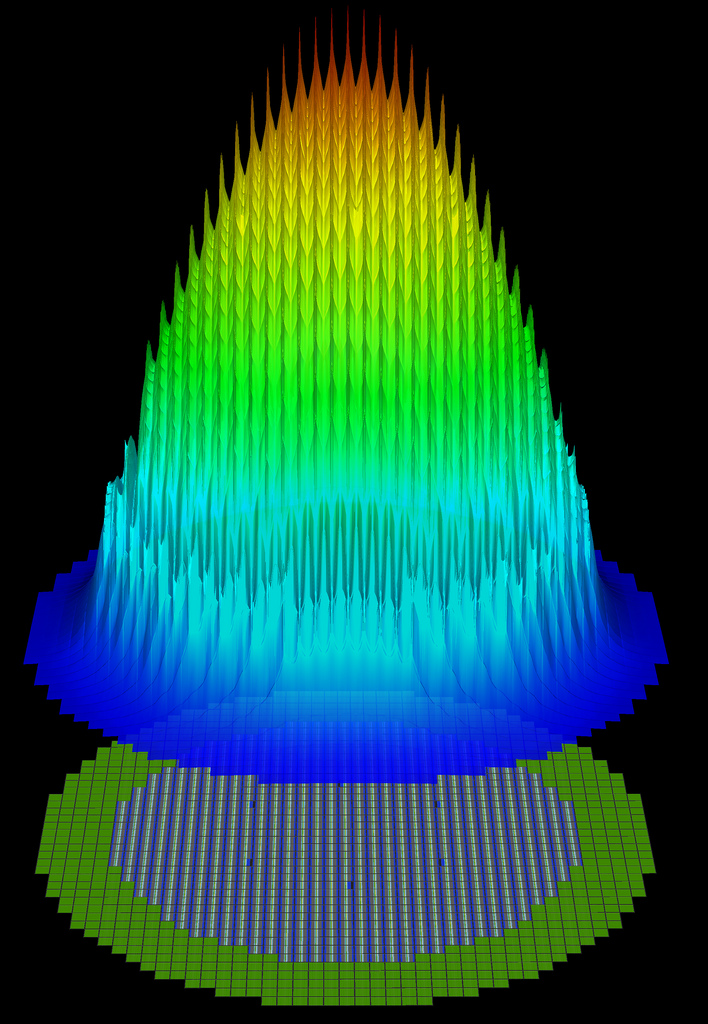
Image: An elevation plot of the highest energy neutron flux distributions from an axial slice of a nuclear reactor core is shown superimposed over the same slice of the underlying geometry. This figure shows the rapid spatial variation in the high energy neutron distribution between within each plate along with the more slowly varying, global distribution. The figure is significant since UNIC allows researchers to capture both of these effects simultaneously.