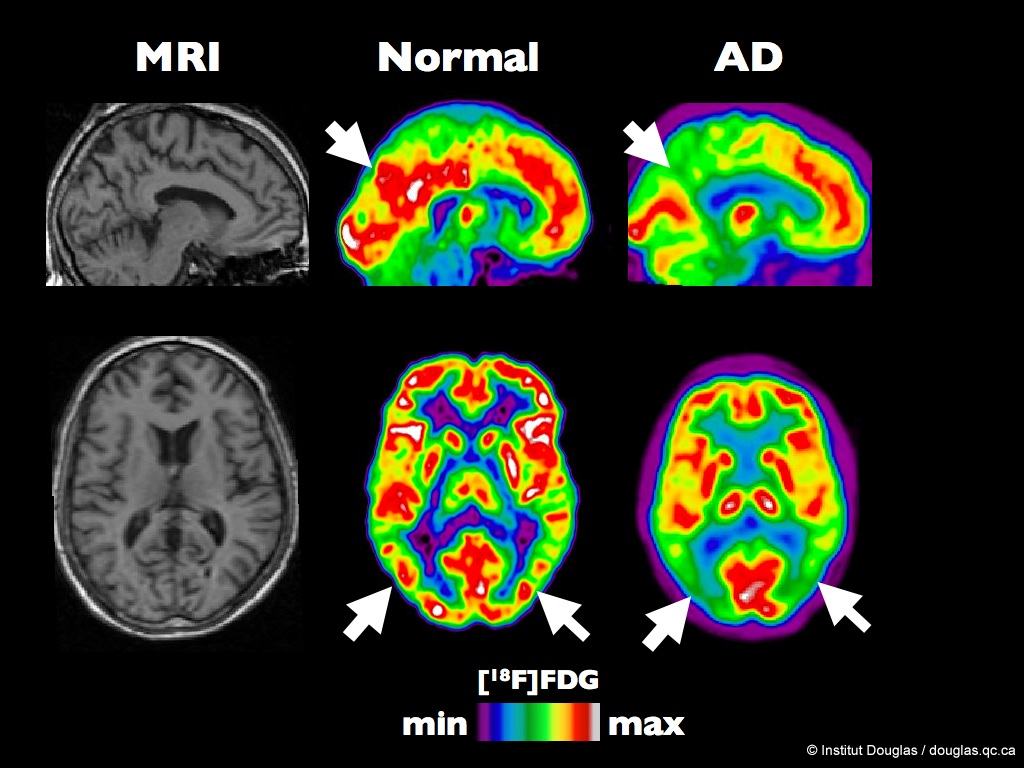
The figure shows MRI, and typical [18F]FDG images from a healthy volunteer and a Alzheimer Disease (AD) patient. The color scale express the rate of glucose utilization (from minimum to maximum). In these PET (Positron Emission Tomography) images (column 2 and 3), the white and red colors represent the regions of the brain with the highest glucose utilization rates while the green and blue represent the hypometabolic brain areas.
The arrows show the posterior temporo-parietal junction (lower row) and the posterior cingulate gyrus (top row).
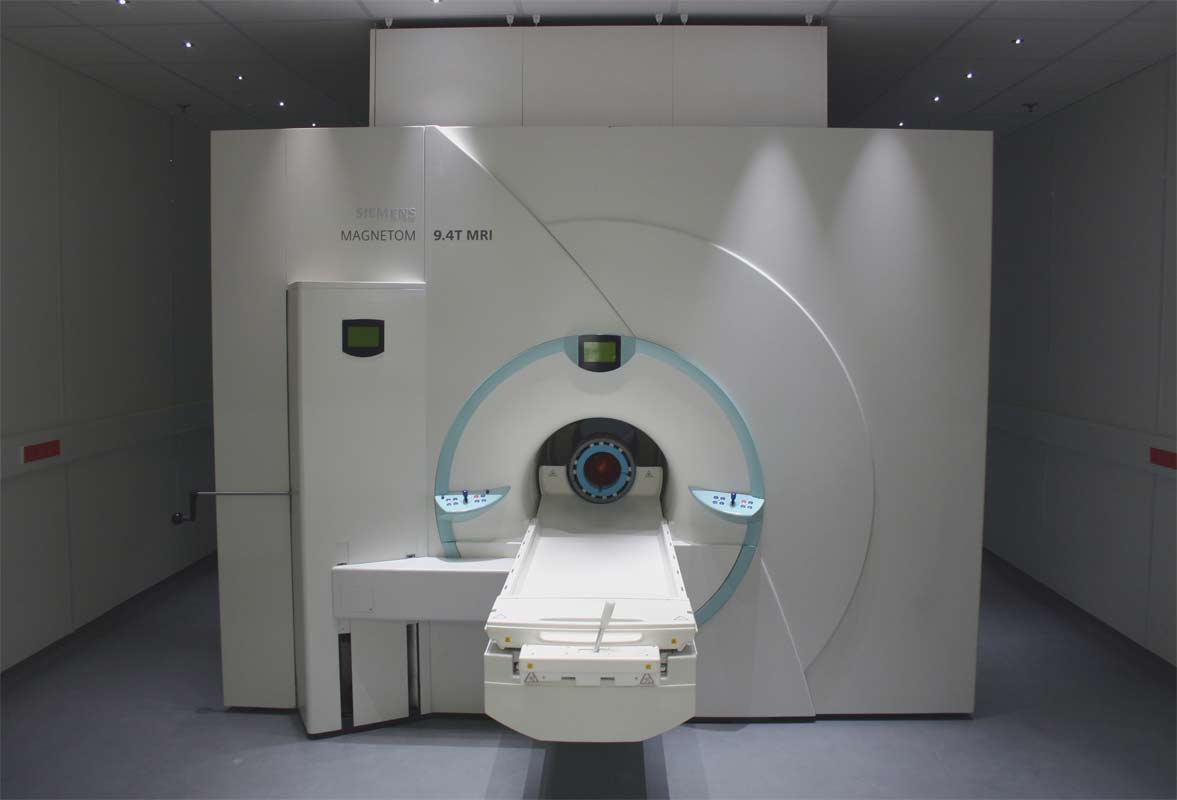
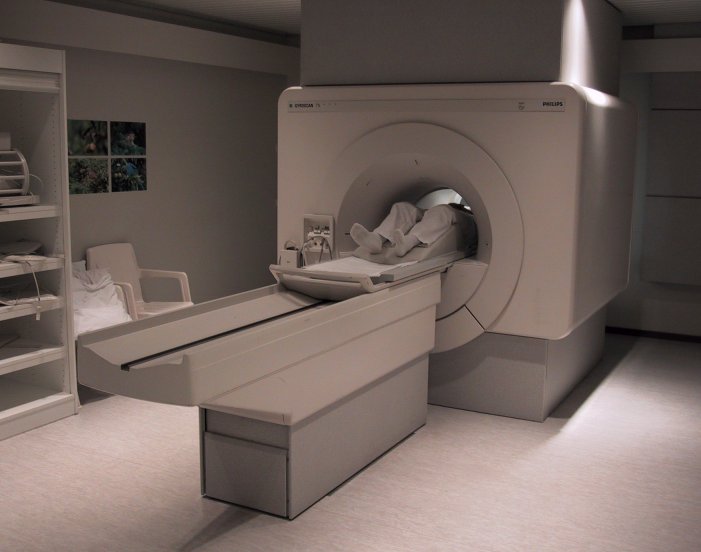
Einsichten in den Körper: Mit den drei Tomografen des Magnetresonanzzentrums untersuchen Wissenschaftler Menschen und Tiere. Hier zu sehen ist der 9,4-Tesla-Magnet mit einer Liegefläche für die Probanden.
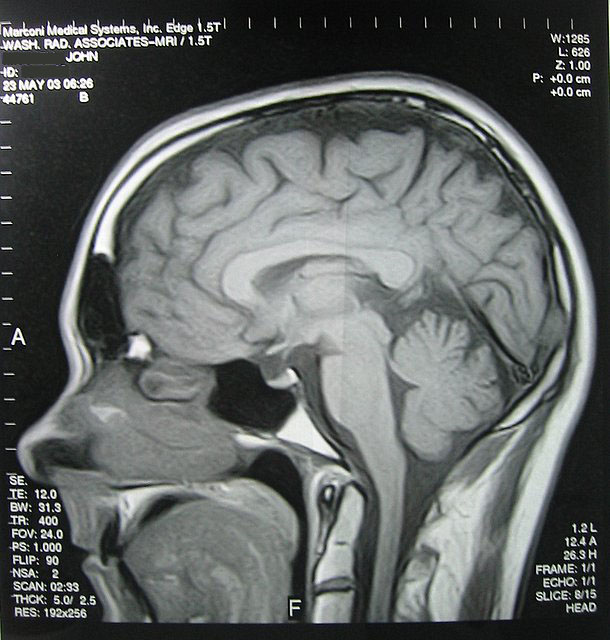
An MRI shot of my brain before my posterior fossa decompression (brain surgery) for Arnold Chiari Malformation.
See the white blob towards the bottom right? That's not supposed to be there - it's my cerebellum sinking down into my spinal column. That's what Chiari does. The brain drops down & blocks the flow of CSF (spinal fluid.) Bad news & I was sick for almost three years before getting diagnosed in the fall of 2005.
Posterior fossa decompression is where they remove part of the back of your skull & create a patch that holds your cerebellum up.