
Weitere Unterabschnitte: aktuelle Daten | Satelliten | Klimawandel | Erdbeben - Tsunami
Wetter und Klima
Allgemeines
Klimawandel
Politiker diskutieren Klimawandel in Second Life
Erdbeben - Tsunami
Japan Earthquake
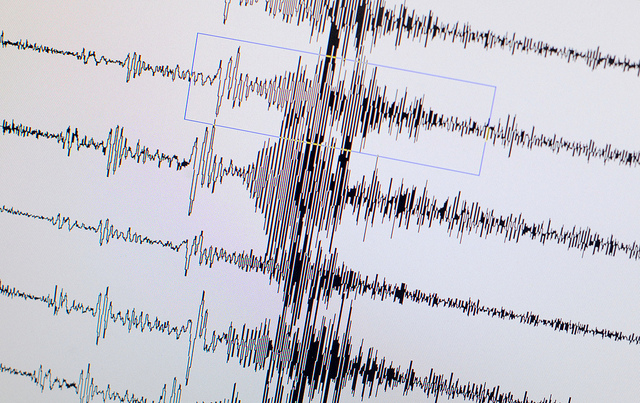
A monitor displays the seismological chart of the earthquake which hit Japan on March 11, 2011 at the Geozentrum geological science center in Hanover, central Germany. At least 40 people were killed and 39 missing in the massive 8.9-magnitude earthquake that hit Japan, unleashing huge tsunamis along its Pacific coast, police said. AFP PHOTO PETER STEFFEN GERMANY OUT (Photo credit should read PETER STEFFEN/AFP/Getty Images)
Bild: Beacon Radio
Satelliten-Bilder
Tropical Cyclone Jasmine

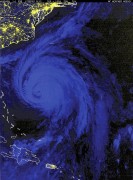
By February 8, 2012, Tropical Cyclone Jasmine had traveled eastward past the island of New Caledonia. The Moderate Resolution Imaging Spectroradiometer (MODIS) on NASA’s Terra satellite captured this natural-color image at 9:45 a.m. local time on February 9, 2012.
That day, the U.S. Navy’s Joint Typhoon Warning Center (JTWC) reported that Jasmine had maximum sustained winds of 105 knots (195 kilometers per hour) and gusts up to 130 knots (240 kilometers per hour). Located roughly 510 kilometers (275 nautical miles) east-southeast of Noumea, New Caledonia, the storm was expected to continue moving in an eastward direction and to weaken.
NASA image courtesy Jeff Schmaltz, LANCE/EOSDIS MODIS Rapid Response Team at NASA GSFC. Caption by Michon Scott.
Bild: NASA Earth Observatory
EUMETSAT IPPS animation –
-
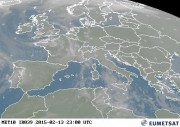
- EUMETSAT Latest Images VIS 0.6 Central Europe Color

-

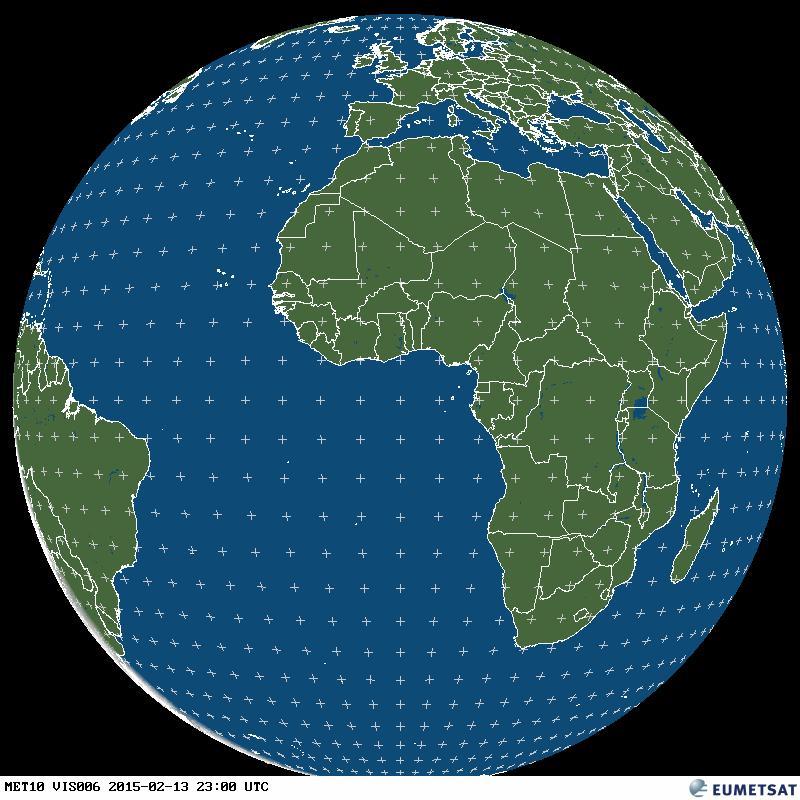
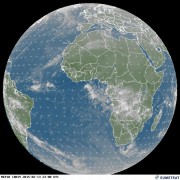
- EUMETSAT Latest Images VIS Weltkugel
AF.mil – Home
-
- Satellite image

-
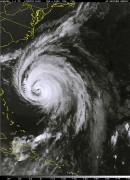
- Isabel hits East Coast

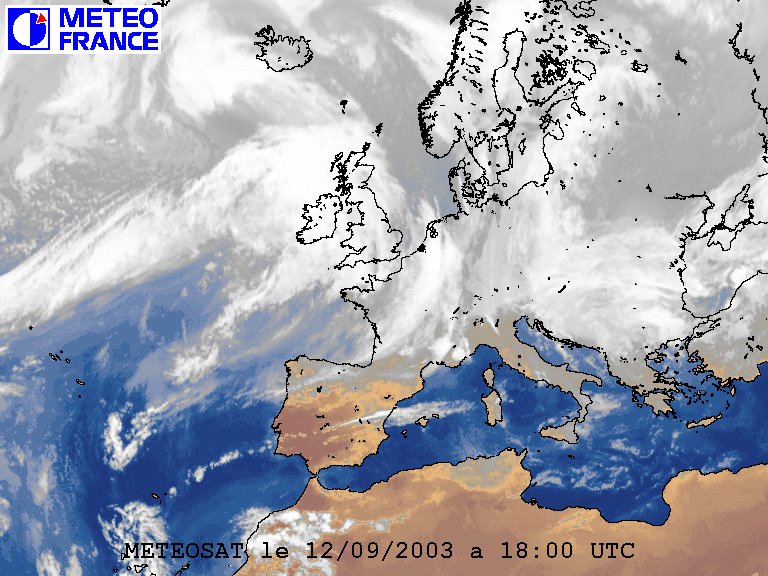
Météo-France
-
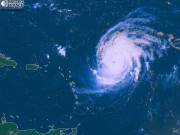
- Ouragan Fabian aux Antilles. Image prise par le satellite GOES12 le 1 septembre 2003 à 13h UTC

-
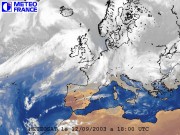
- IMAGE GRAND FORMAT – EUROPE
-
- IMAGE PREVUE – EUROPE

-
- ANIMATION INFRA-ROUGE – EUROPE

METEOSAT
Spezialkarten
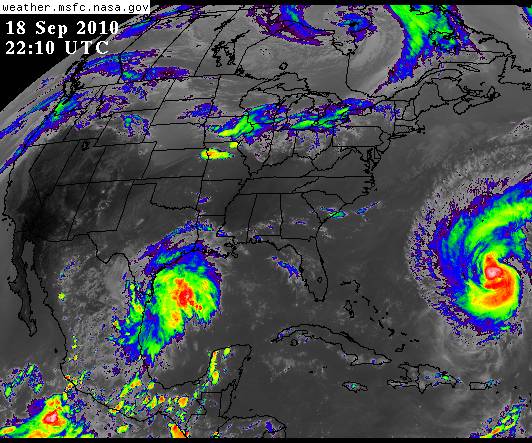
Looking Inside Hurricane Rina
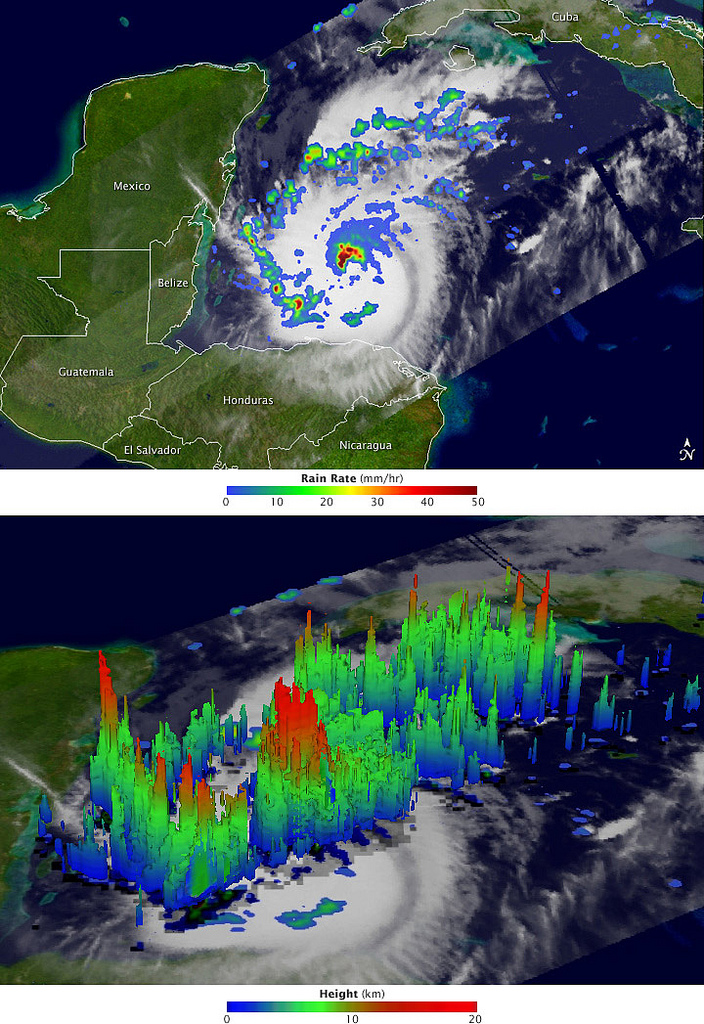
After a two-week period without any named storms, the 2011 Atlantic hurricane season revived in late October with the arrival of Hurricane Rina. The storm, which began as a tropical depression on October 23 in the western Caribbean, is adding misery and destruction to a region that has been battered by heavy rain and flooding events.
The Tropical Rainfall Measuring Mission (TRMM) collected these images of Rina at 8:06 Universal Time (3:06 am Central Daylight Time) on October 26, 2011, while located about 200 miles (330 kilometers) east of Belize. The top image shows a nadir, or straight down, view of rain intensities within Rina. Rain rates in the center of the field of view (or swath) are measured by the TRMM Precipitation Radar (PR). Those in the outer edges of the swath come from the TRMM Microwave Imager (TMI). Rain rates are overlaid on visible and infrared data from the TRMM Visible Infrared Scanner.
Bild: NASA Earth Observatory
Erklärung der verschiedenen Falschfarbendarstellungen (nur englisch):
Erklärung der verschiedenen Falschfarbendarstellungen (nur englisch):
EUMETSAT IPPS animation –
-
- EUMETSAT Latest Images IR 3.9 Central Europe Color

-
- EUMETSAT Latest Images RGB Composites Dust Central Europe Color

-

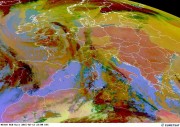
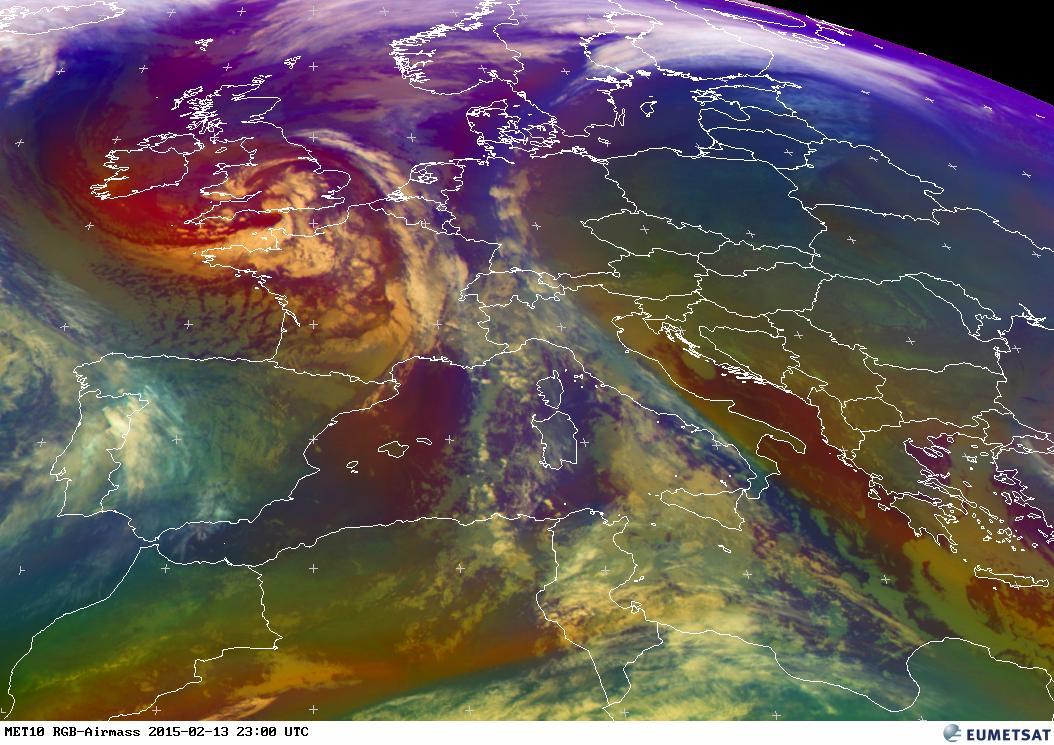
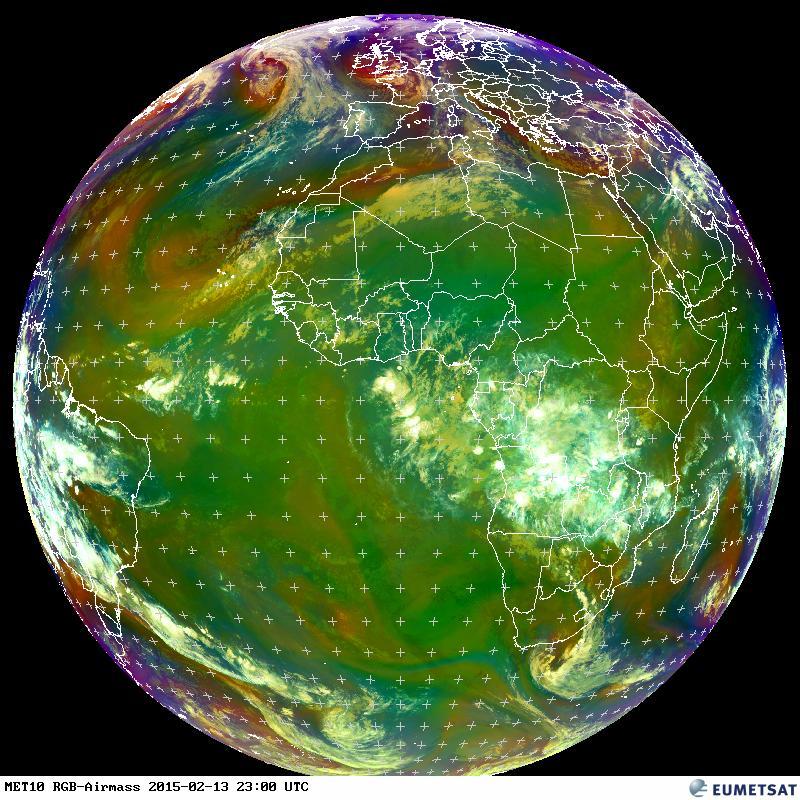
- EUMETSAT Latest Images RGB Airmass Central Europe Color
-
- EUMETSAT Latest Images RGB Fog Central Europe Color
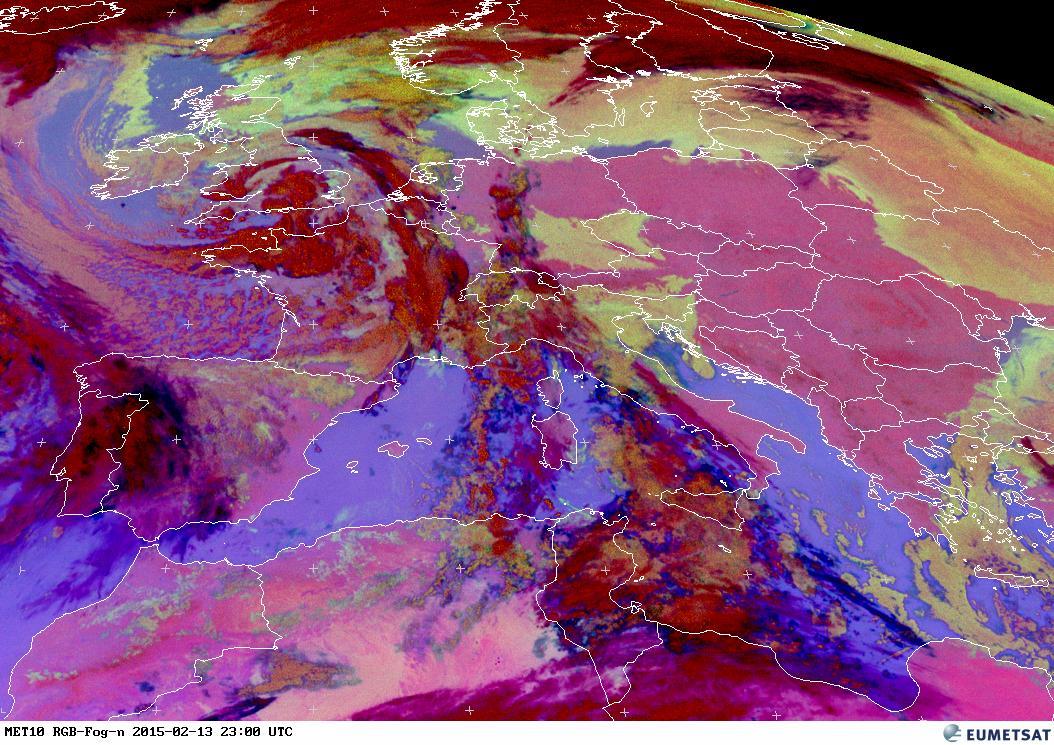
-
- EUMETSAT Latest Images RGB Day Microphysics Central Europe Color

-
- EUMETSAT Latest Images RGB Natural Color Central Europe Color
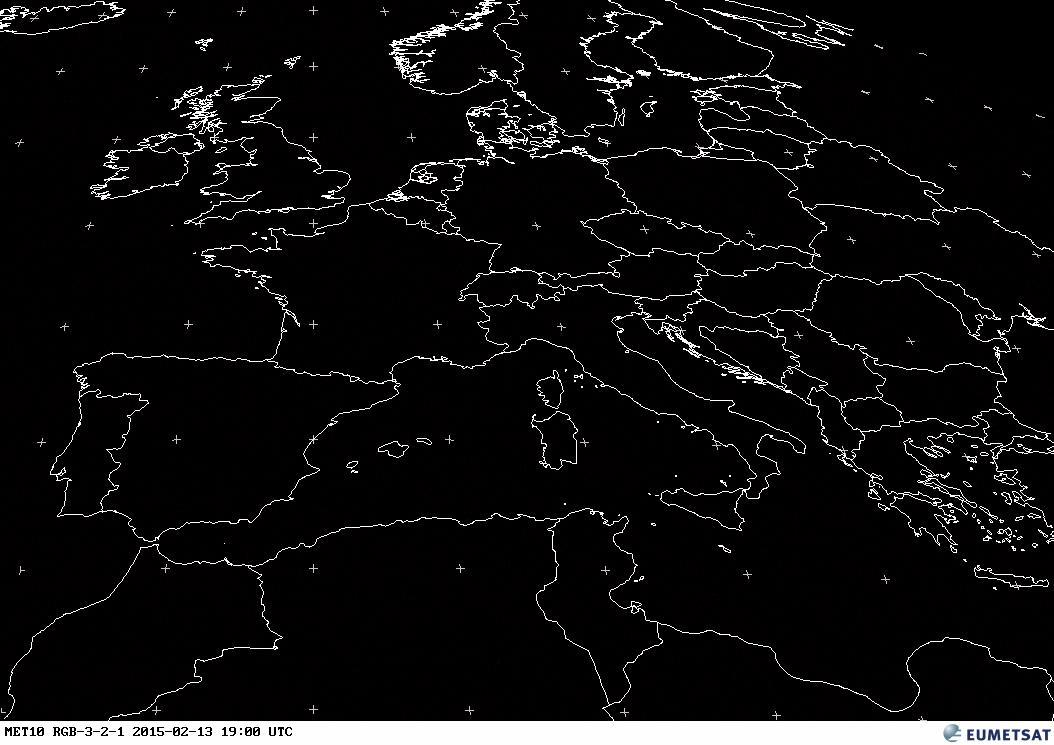
-
- EUMETSAT Latest Images RGB Snow/Solar Day Central Europe

-
- EUMETSAT Latest Images MPE (Multi-Sensor Precipitation Estimate) Central Europe

-
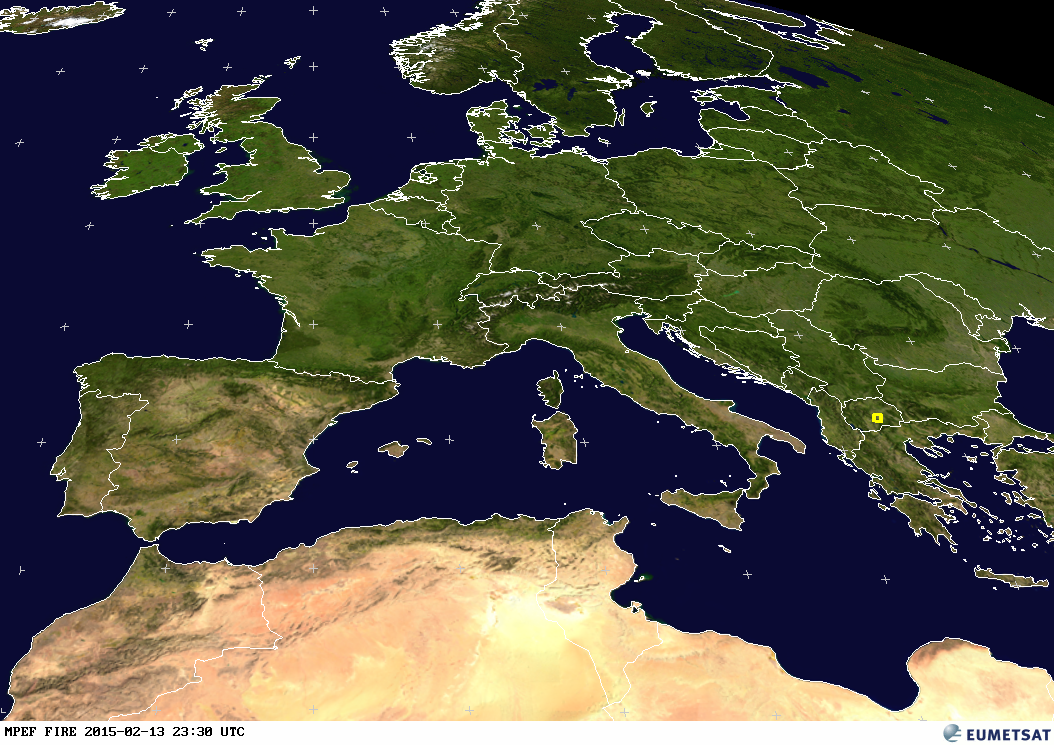
- EUMETSAT Latest Images Fire Central Europe
-
- EUMETSAT Latest Images IR (Infrarot) 3.9 Weltkugel

-
- EUMETSAT Latest Images RGB Composites Dust Weltkugel

-
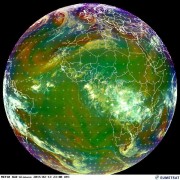
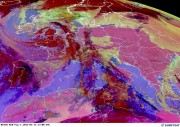
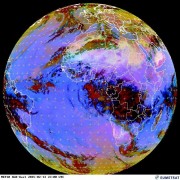
- EUMETSAT Latest Images RGB Airmass Weltkugel
-
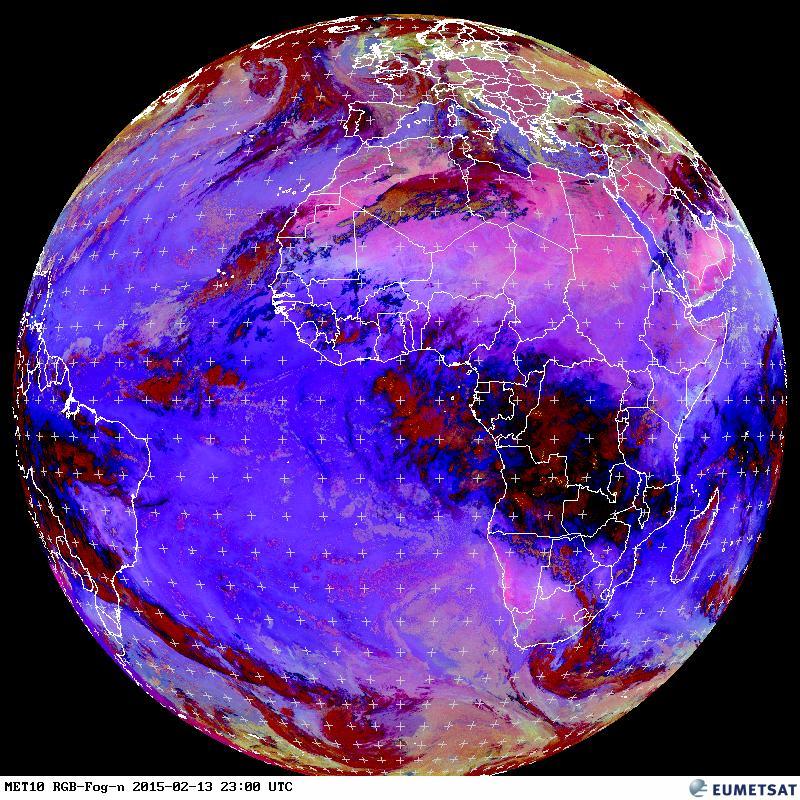
- EUMETSAT Latest Images RGB Fog Weltkugel
-
- EUMETSAT Latest Images RGB Day Microphysics Weltkugel

-
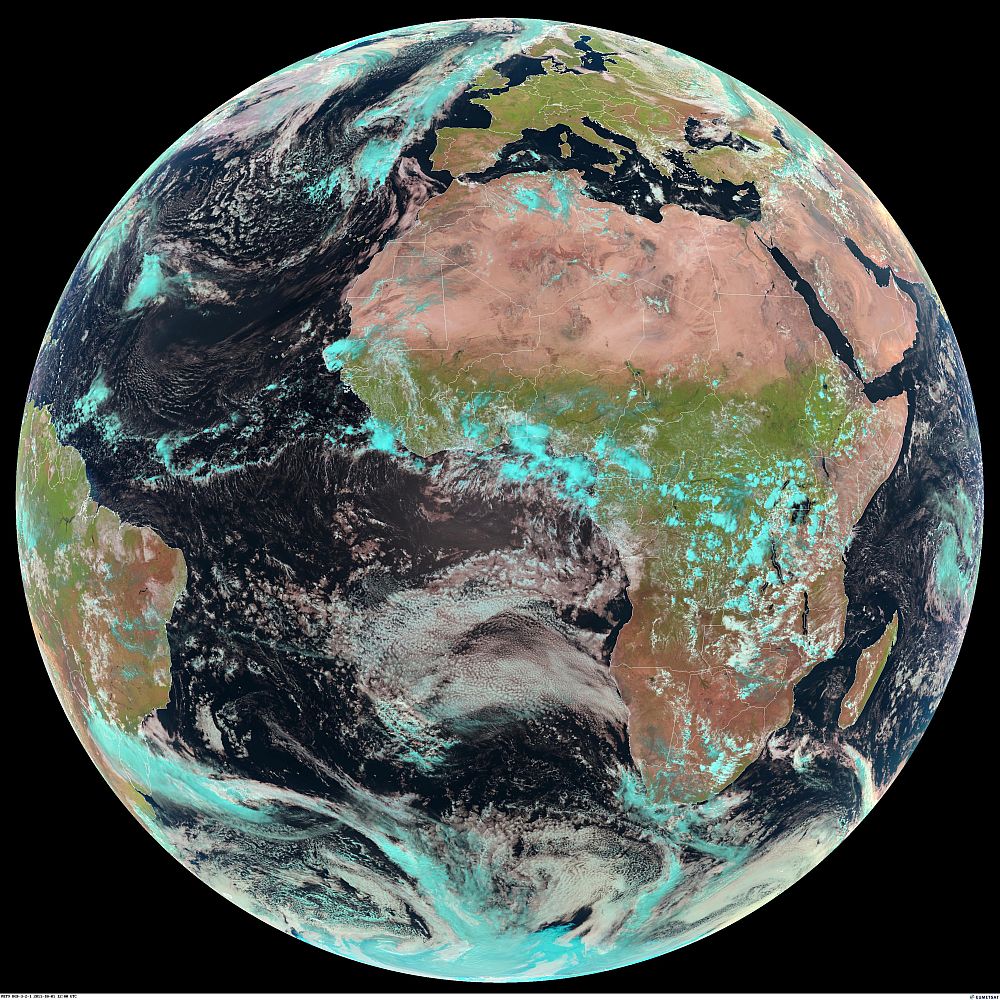
- EUMETSAT Latest Images RGB Natural Color Weltkugel

-
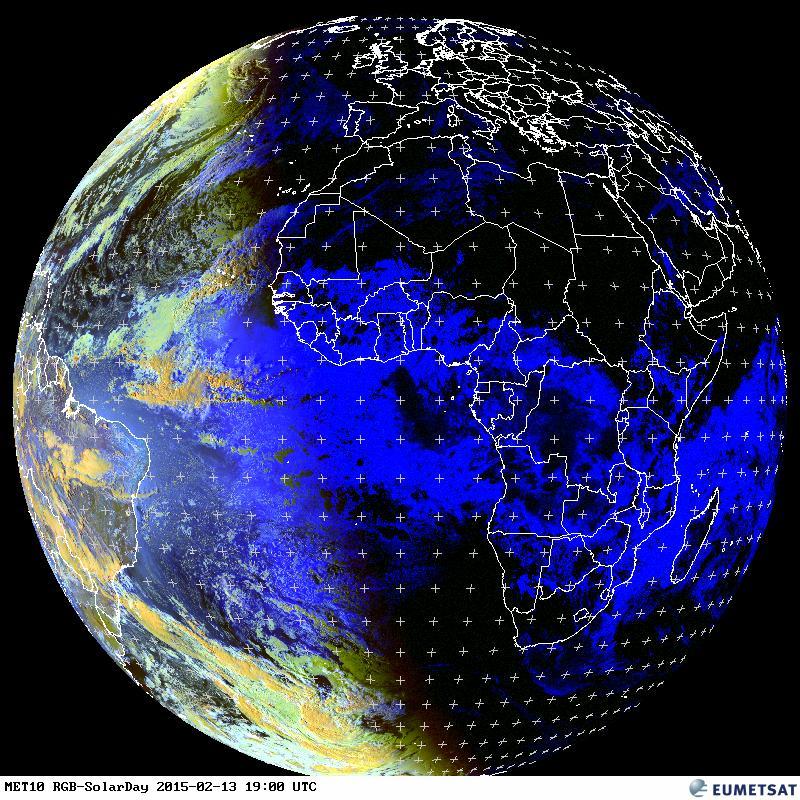
- EUMETSAT Latest Images RGB Snow/Solar Day Weltkugel
-
- EUMETSAT Latest Images MPE (Multi-Sensor Precipitation Estimate) Weltkugel

-

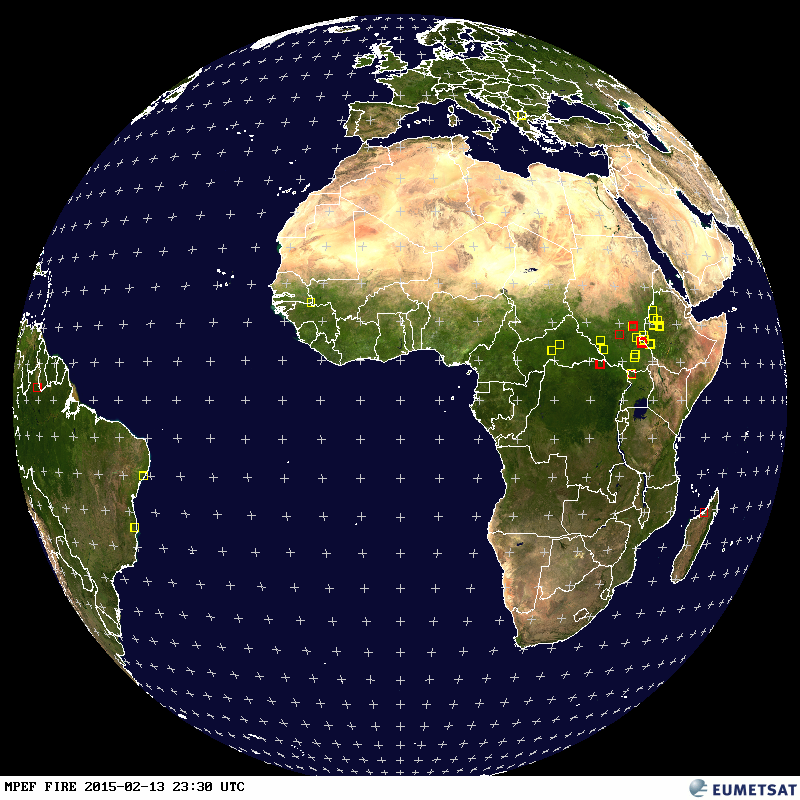
- EUMETSAT Latest Images Fire Weltkugel
-
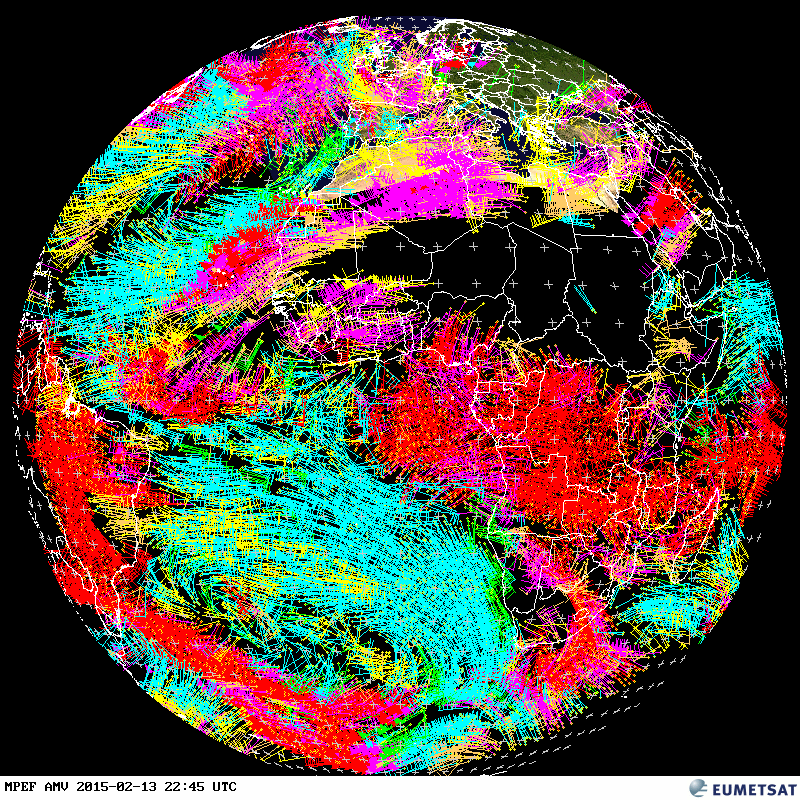
- EUMETSAT Latest Images AMV (Atmospheric Motion Vectors) Weltkugel
-
- EUMETSAT Latest Images GII (Global Instability Index) Weltkugel

-
- EUMETSAT Latest Images CLA (Cloud Analysis) Weltkugel
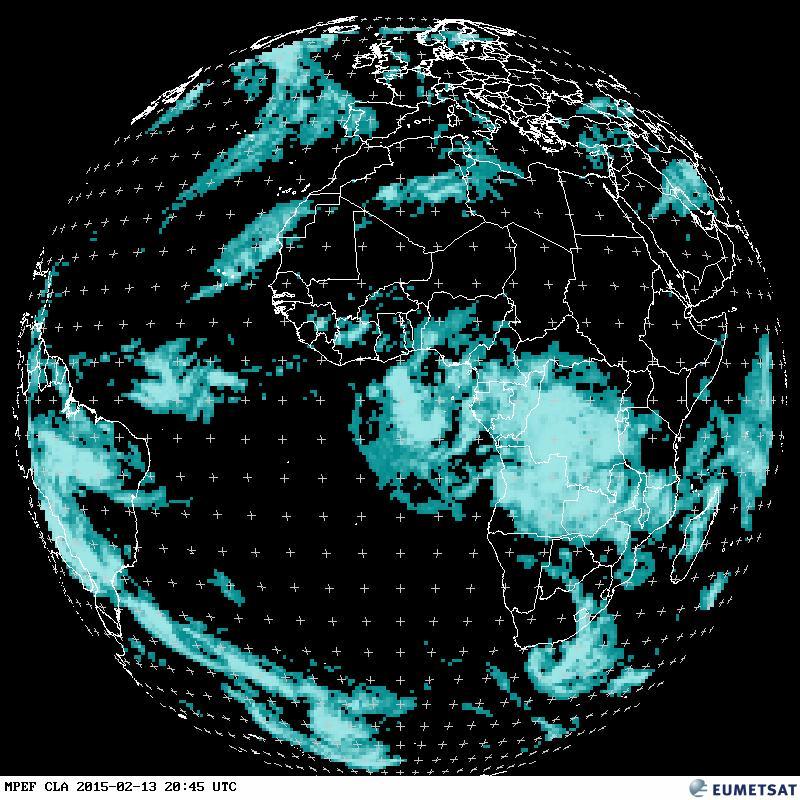
-
- EUMETSAT Latest Images CLAI (Cloud Analysis Image) Weltkugel
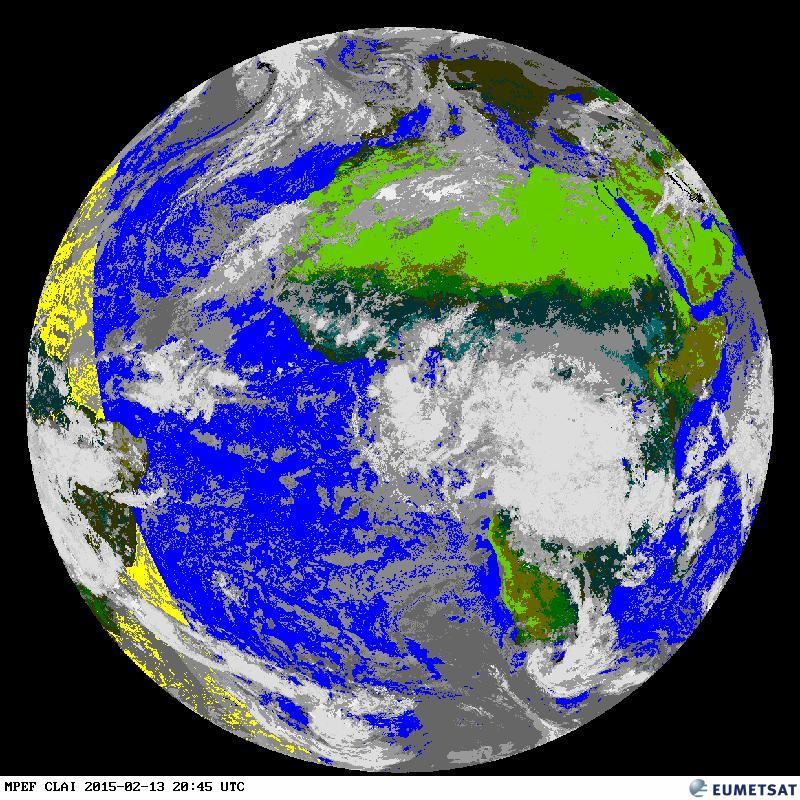
-
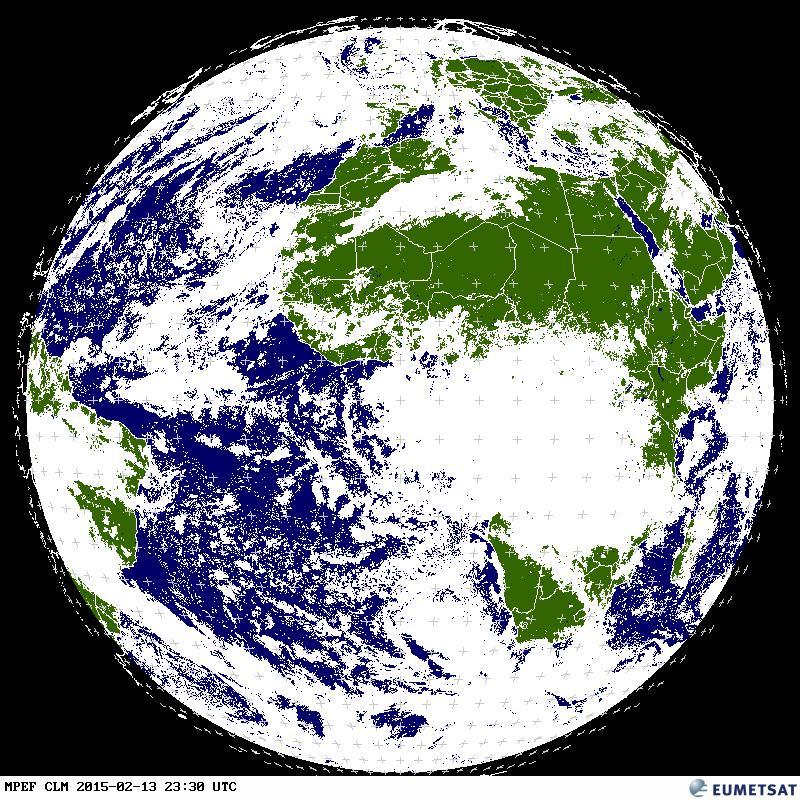
- EUMETSAT Latest Images CLM (Cloud Mask) Weltkugel
-
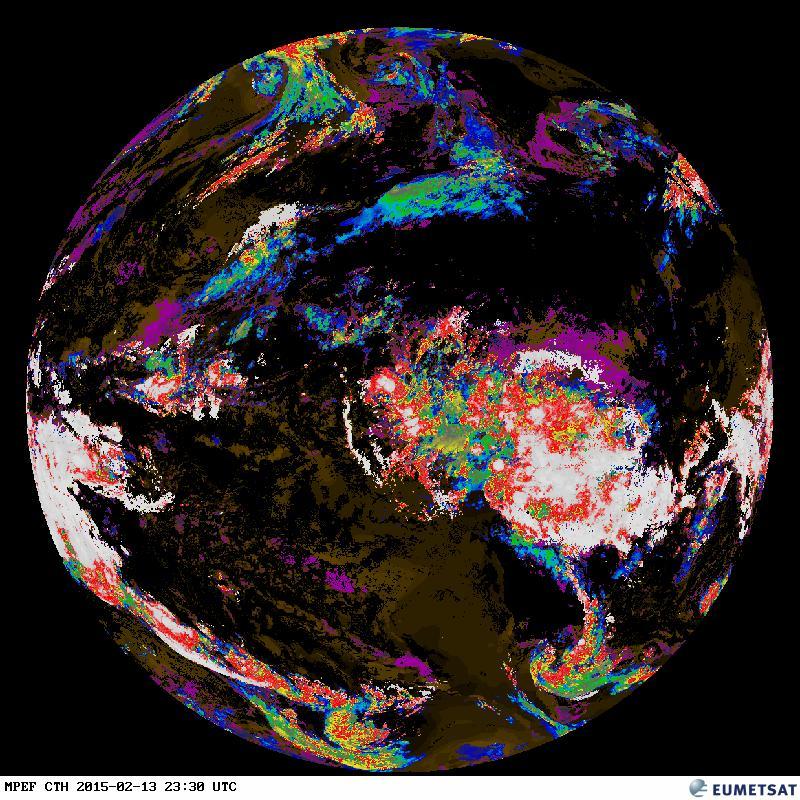
- EUMETSAT Latest Images CTH (Cloud Top Height) Weltkugel
-
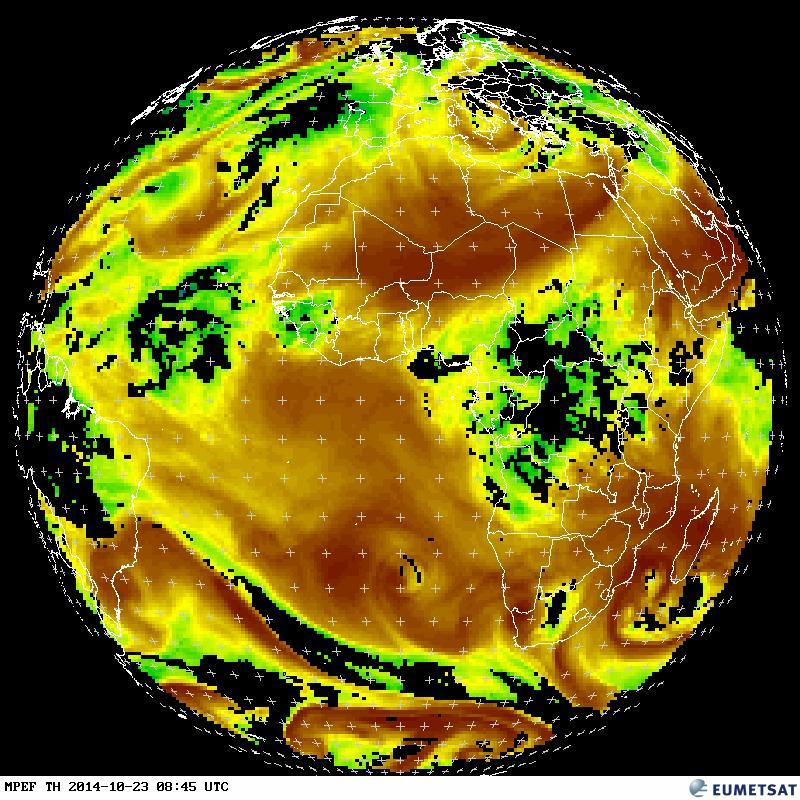
- EUMETSAT Latest Images TH (Tropospheric Humidity) Weltkugel
-
- EUMETSAT Latest Images TOZ (Total Ozone) Weltkugel

EUMETSAT
EUMETSAT – Image Gallery – Topical Images
On Saturday 1 October 2011, a large area of high pressure sat over parts of Europe bringing cloud-free, very hot weather conditions, an unusual occurrence at this time of the year. Some parts of Europe experienced record-breaking temperatures.