
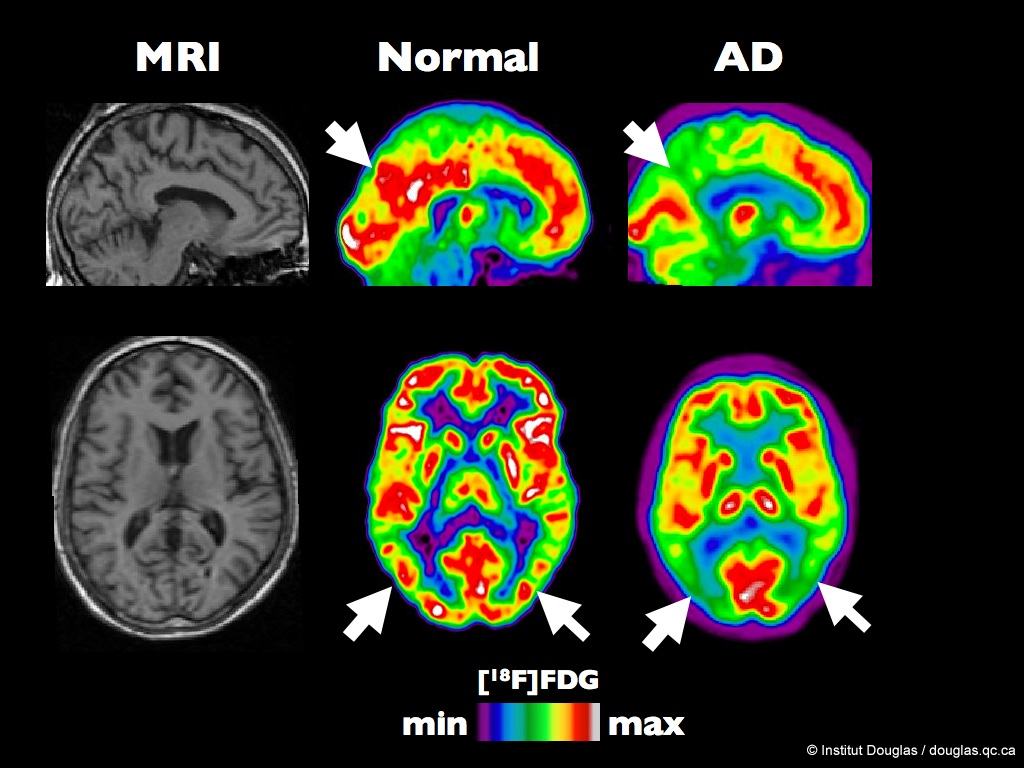
The figure shows MRI, and typical [18F]FDG images from a healthy volunteer and a Alzheimer Disease (AD) patient. The color scale express the rate of glucose utilization (from minimum to maximum). In these PET (Positron Emission Tomography) images (column 2 and 3), the white and red colors represent the regions of the brain with the highest glucose utilization rates while the green and blue represent the hypometabolic brain areas.
The arrows show the posterior temporo-parietal junction (lower row) and the posterior cingulate gyrus (top row).
Bild: Institut Douglas